If you're a RealWear PRO workspace user, click 'Reporting' on the left hand menu to view the device usage metrics
![]()
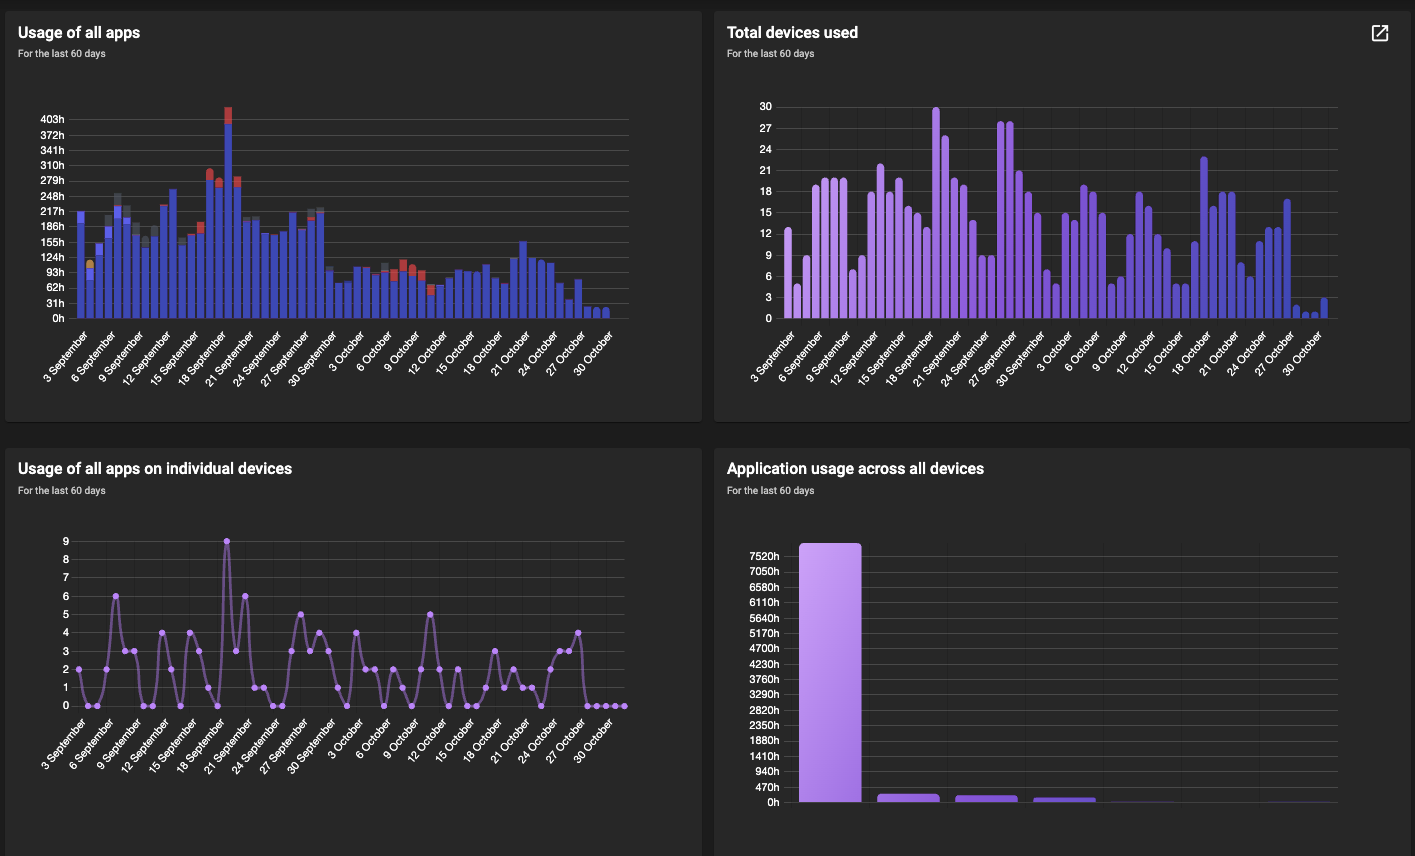
You'll be presented with our usual reporting page, however the upgraded feature enabling you to see see over an extended time period is available on the top right of the page.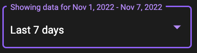
With this box you can show the data over 7 days, 14 days, 30 days, 60 days, or choose your own custom date range by selecting custom, and using the date picker.